

Spanish
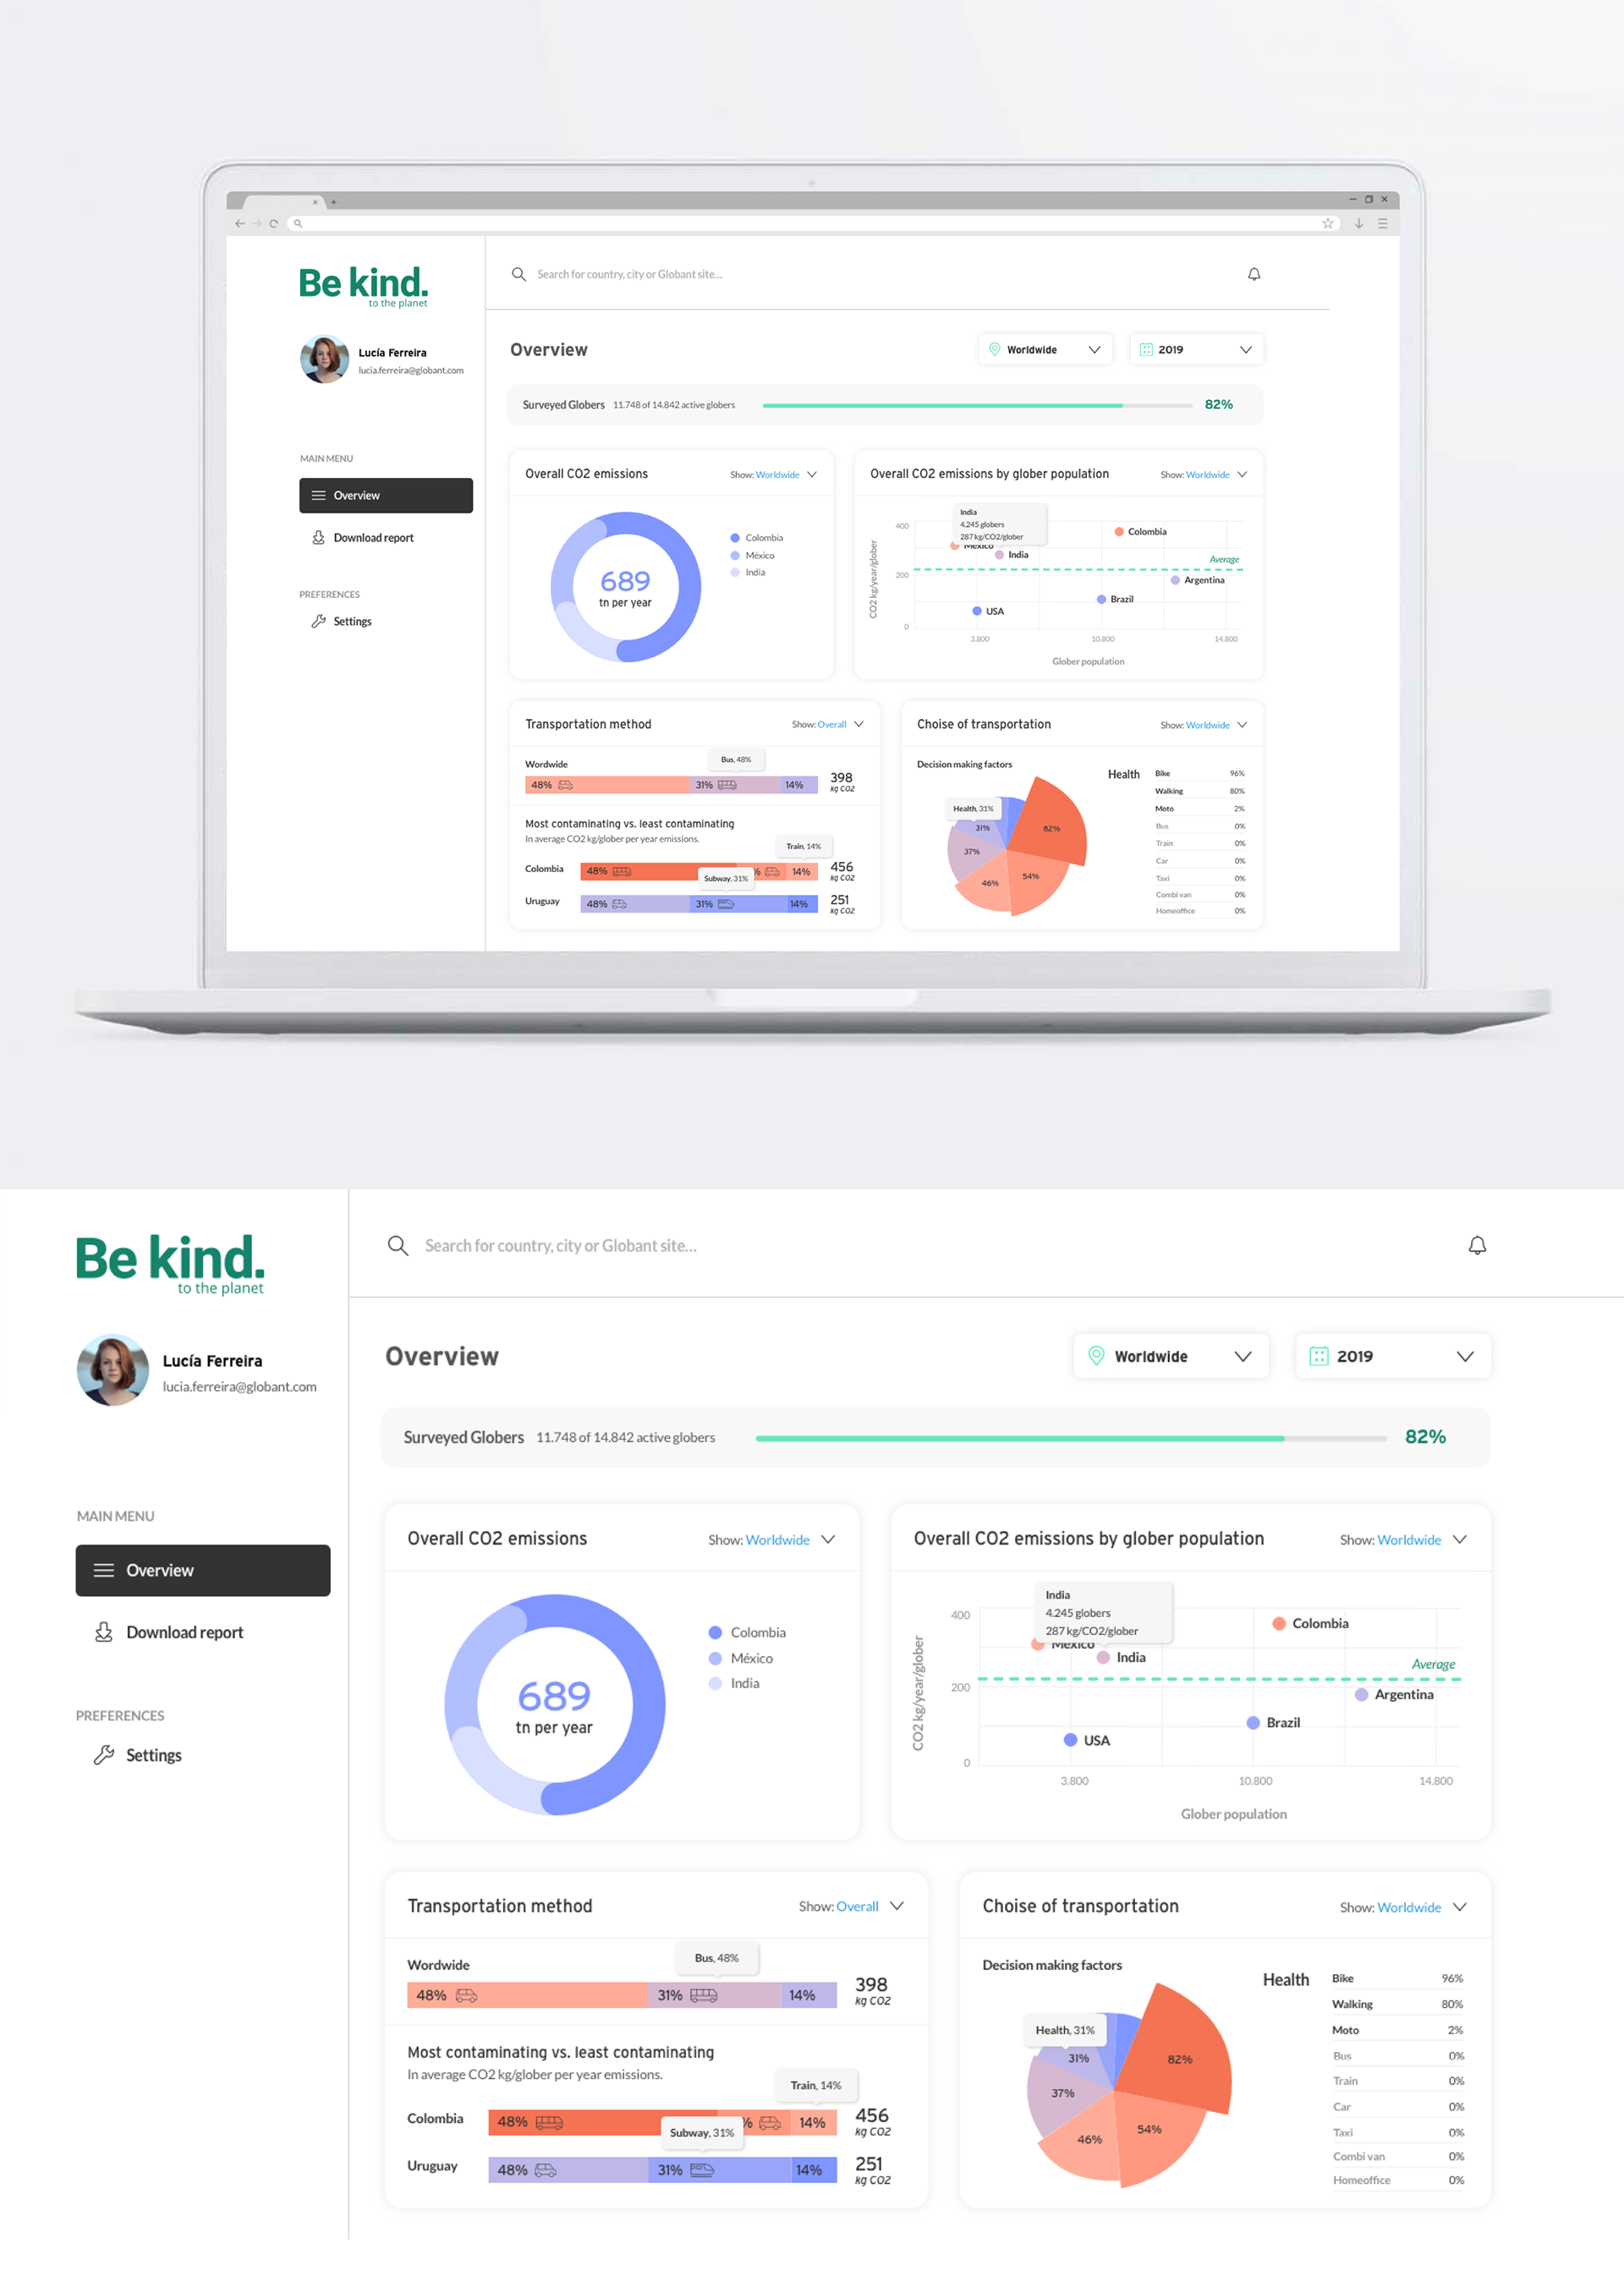
El objetivo de este Dashboard es informar al equipo los resultados obtenidos de la encuesta MyFootprint, que mide la huella de carbono de los empleados por traslados a sus oficinas.
Entre las consideraciones, hubo que tener en cuenta el año y el país para plasmar la información en los respectivos gráficos. La información se analizó de manera Worldwide y también filtrada por país, con la posibilidad de analizar sus diferentes ciudades.
Mapear la cantidad de emisiones, la relación entre cantidad de empleados y consumo, sus métodos más utilizados y los motivos de selección de transporte, nos permiten tomar insights para entender mejor la situación y así luego tomar decisiones.
Si, por ejemplo, estamos en el escenario de que uno de los países mapeados genera una gran huella de carbono ya que la mayoría de sus empleados se trasladan en vehículos de alto consumo: tras el informe, entendemos que el motivo principal son las grandes distancias, a partir de esta información, la compañía puede tomar nuevas medidas por subvenciones de transportes mas ecológicos, o al momento de instalar una nueva oficina tener esto en consideración.
Así como a su vez, ver focos de posibilidades: en una ciudad donde las oficinas quedan cerca y gran cantidad de trabajadores usan auto se pueden evaluar distintas soluciones, como descuentos o seguros para bicicletas, incentivar el carpooling, entre otras.
Así como a su vez, ver focos de posibilidades: en una ciudad donde las oficinas quedan cerca y gran cantidad de trabajadores usan auto se pueden evaluar distintas soluciones, como descuentos o seguros para bicicletas, incentivar el carpooling, entre otras.
English
The objective of this Dashboard is to inform the team of the results obtained from the MyFootprint survey, which measures the carbon footprint of employees for commuting to their offices.
Among the considerations, it was necessary to take into account the year and the country to capture the information in the respective graphs. The information was analyzed worldwide and also filtered by country, with the possibility of analyzing its different cities.
Mapping the amount of emissions, the relationship between the number of employees and consumption, its most used methods and the reasons for selecting transport, allow us to take insights to better understand the situation and thus make decisions.
If, for example, we are in the scenario that one of the mapped countries generates a large carbon footprint since most of its employees travel in high consumption vehicles: after the report, we understand that the main reason is the great distances. Based on this information, the company can take new measures for subsidies for more ecological transport, or when installing a new office, take this into consideration.
As well as, in turn, seeing sources of possibilities: in a city where offices are close and a large number of workers use cars, different solutions can be evaluated, such as discounts or insurance for bicycles, encouraging carpooling, among others.
As well as, in turn, seeing sources of possibilities: in a city where offices are close and a large number of workers use cars, different solutions can be evaluated, such as discounts or insurance for bicycles, encouraging carpooling, among others.